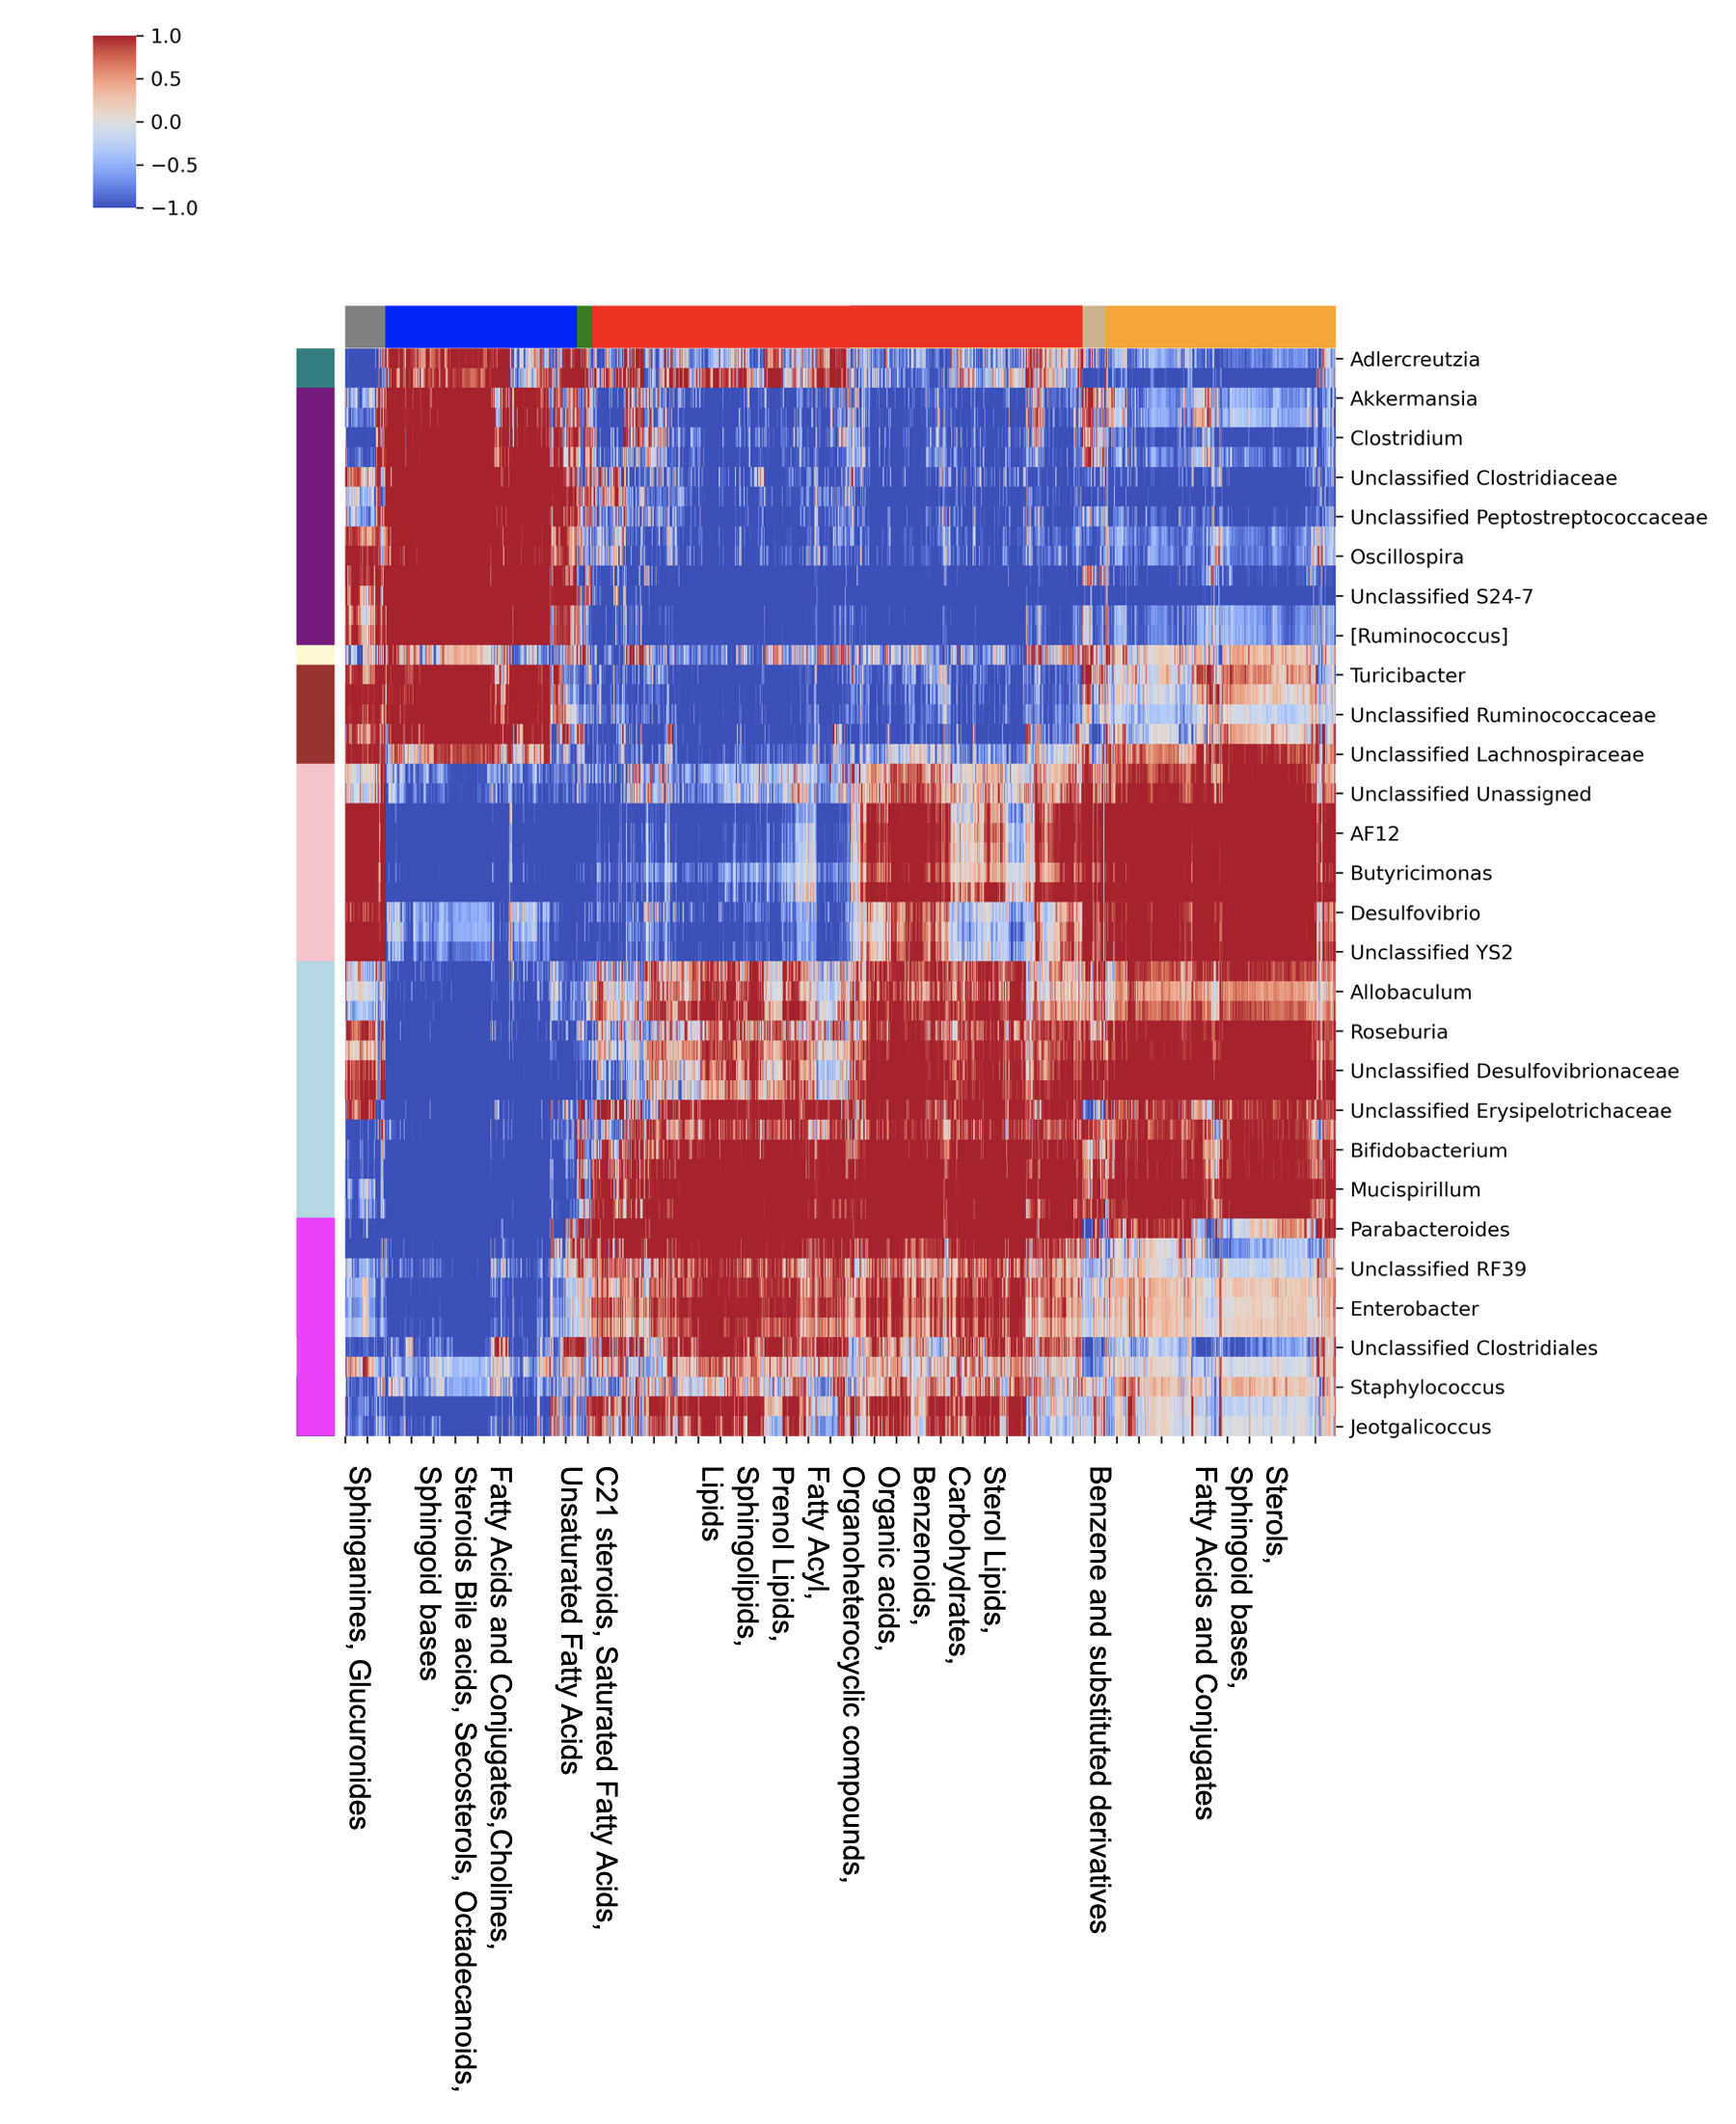
Clustering of microbes and metabolites based on the feature attribution scores
The heatmap illustrates the interactions between microbiome and metabolome modules. Different colors on the axes represent various modules for metabolite compounds and microbiome modules. Red indicates positive interactions, while blue represents negative interactions.

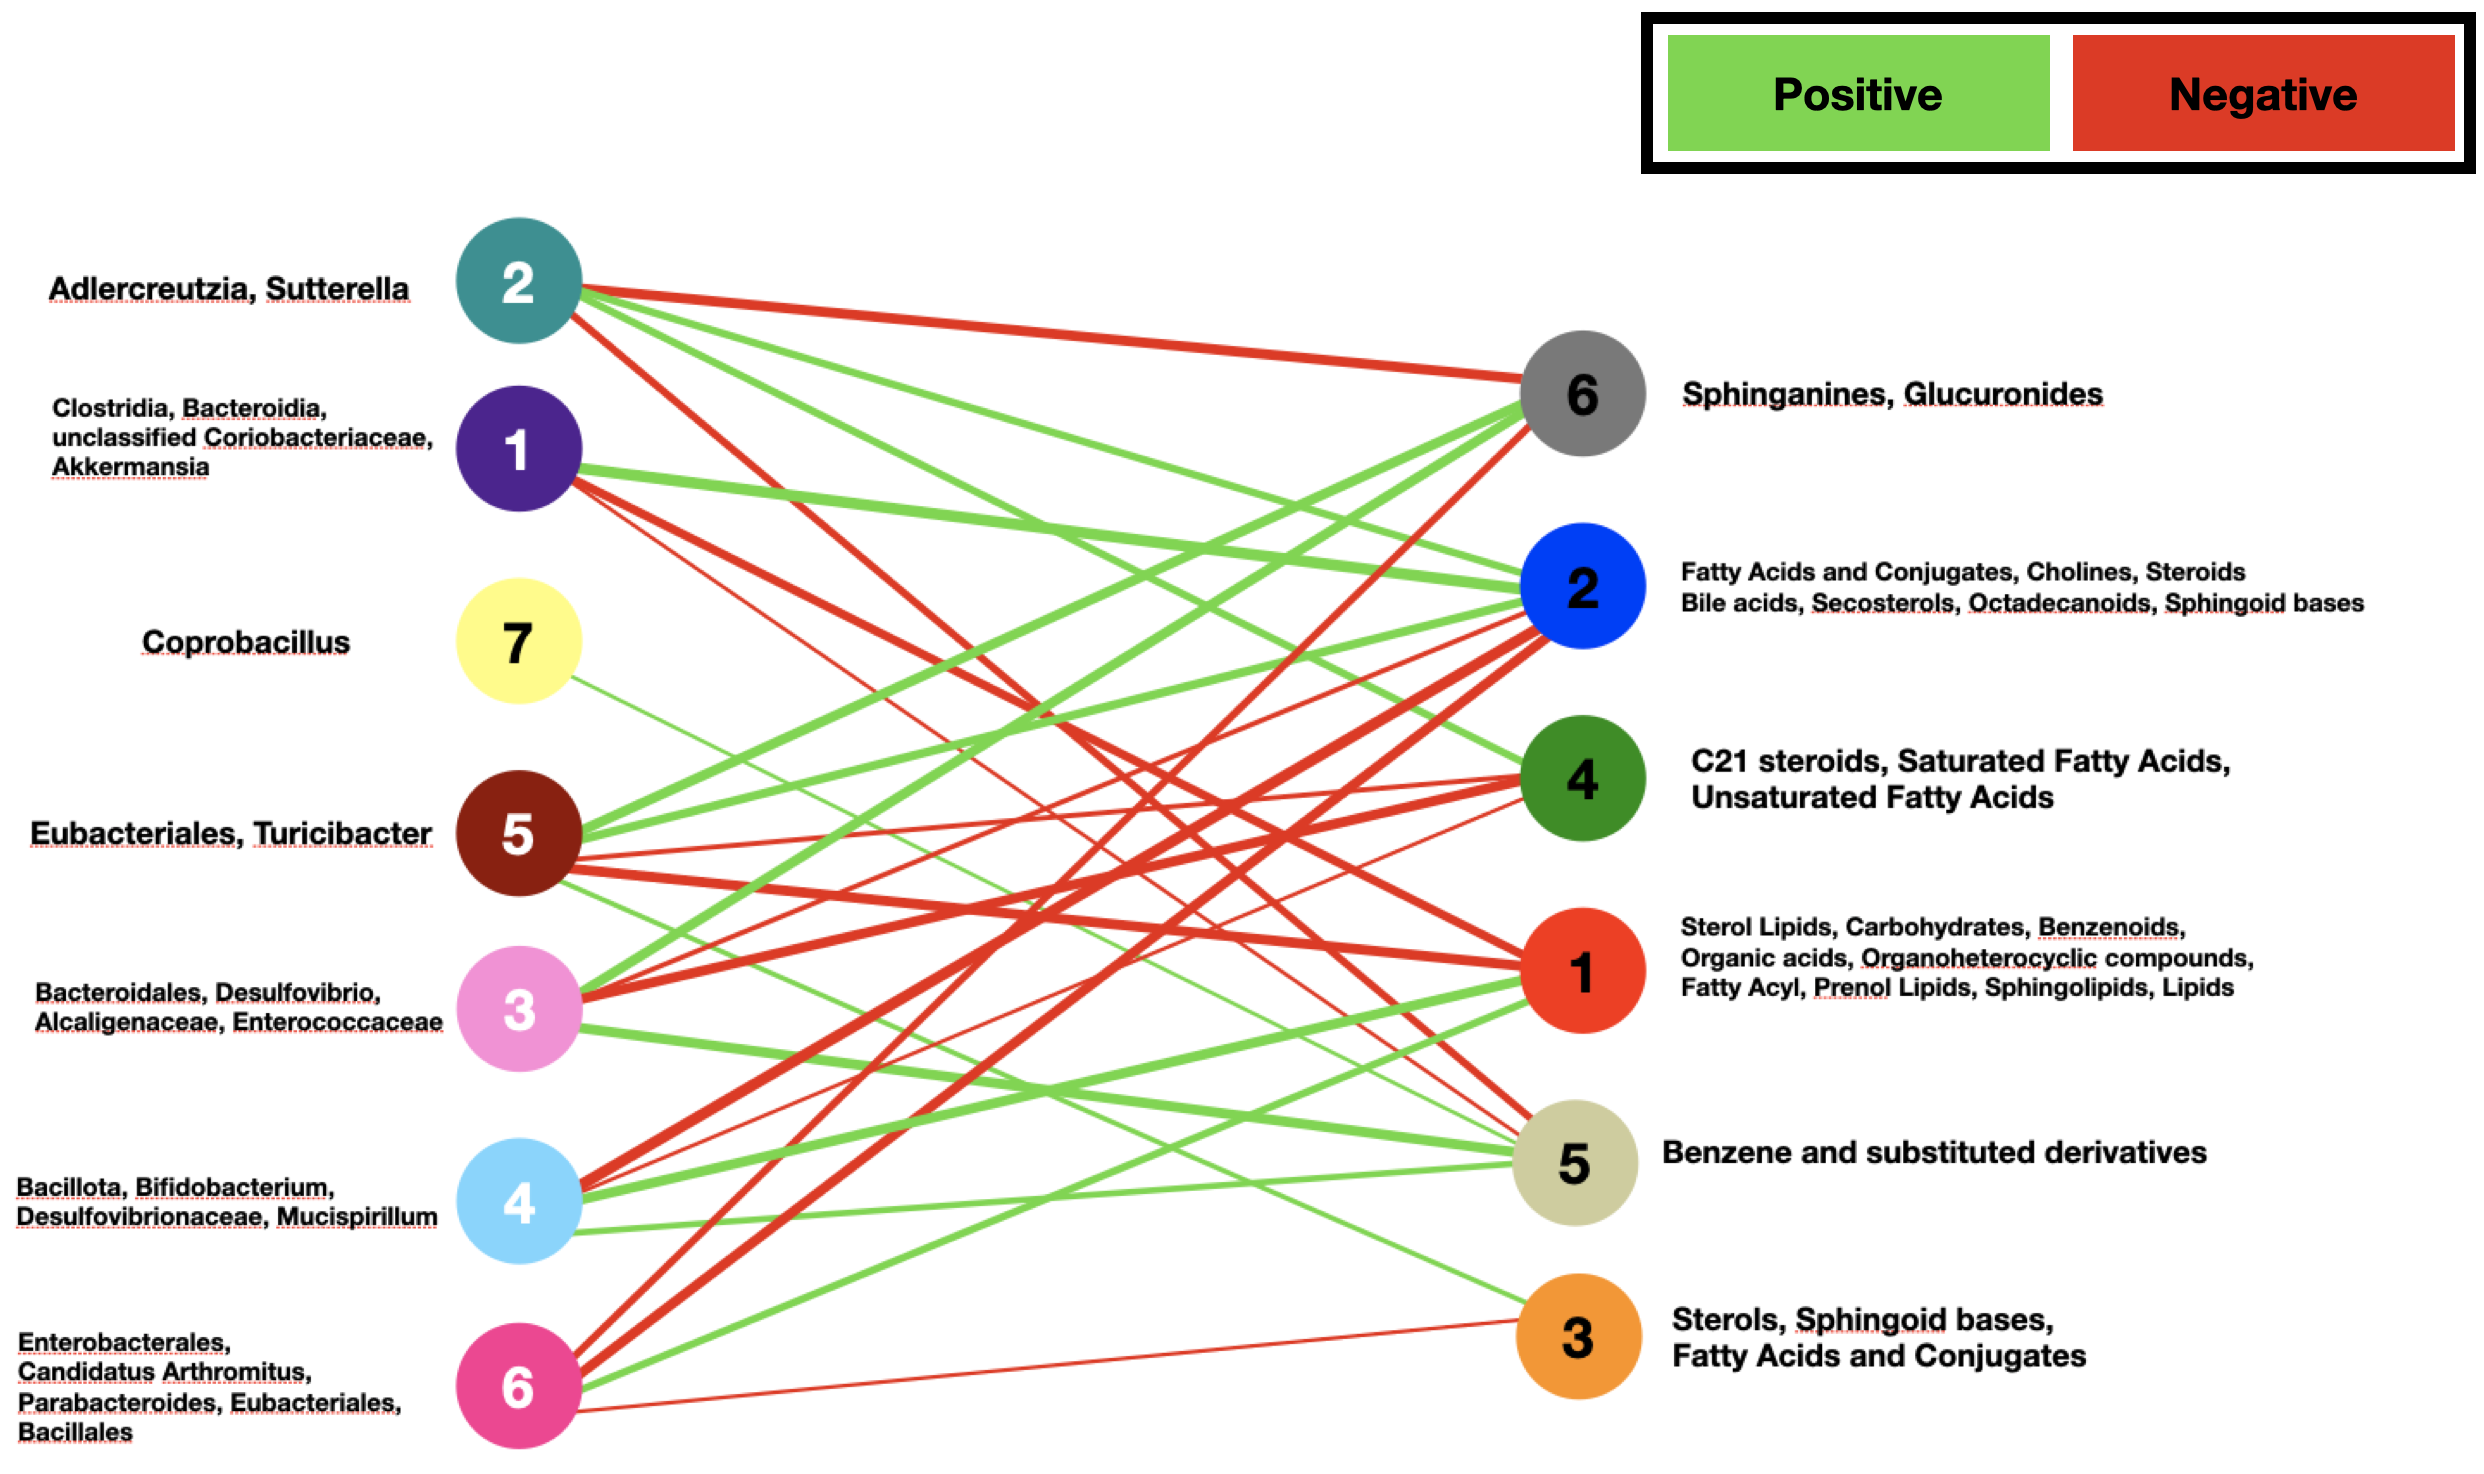
Network connecting microbial modules with metabolomic modules
The bipartite graph displays the network between microbiome and metabolome modules. Circle shapes in different colors represent modules for microbes and metabolite compounds. Red edges indicate weak negative interactions, while green edges represent strong positive interactions. The width of the edges corresponds to the strength of the interaction. For example, wide green lines indicated strong positive interactions and thin red lines indicate weak negative interaction.

